View the characteristics of the SJLIFE cohort relative to the CCSS cohort. The table was last updated October 31, 2022.
St. Jude Family of Websites
Explore our cutting edge research, world-class patient care, career opportunities and more.
St. Jude Children's Research Hospital Home

View the characteristics of the SJLIFE cohort relative to the CCSS cohort. The table was last updated October 31, 2022.
| Characteristics | Breakdown | SJLIFE Cohort (n=9366) Dx 1962-2012 |
CCSS Cohort (n=25,665) Dx 1970-99 |
|---|---|---|---|
| Sex | Female | 45.3% | 46.5% |
| Male | 54.7% | 53.5% | |
| Race Ethnicity | White not Hispanic | 76.8% | 79.4% |
| Black not Hispanic | 16.9% | 6.2% | |
| American Indian/Alaska Native | 0.1% | <1.0% | |
| Asian Pacific Islander | 0.5% | 0.5% | |
| Hispanic | 4.0% | 7.8% | |
| Other | 1.5% | 3.3% | |
| Unknown | 0.2% | 1.1% | |
| Primary Diagnosis | Leukemia | 32.1% | 30.7% |
| Lymphoma | 15.3% | 20.3% | |
| CNS tumor | 18.0% | 17.5% | |
| Embryonal tumors | 17.3% | 16.5% | |
| Bone and Soft Tissue Sarcoma | 11.9% | 15.0% | |
| Carcinoma | 0.8% | 0.0% | |
| Other | 4.6% | 0.0% |
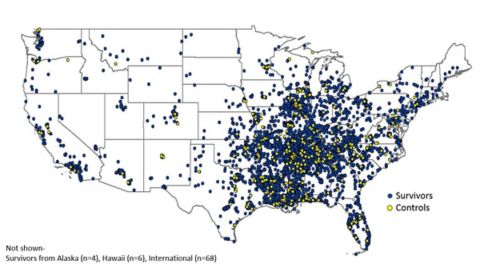
The SJLIFE cohort is geographically diverse with the largest proportion of participants from the mid-South region of the United States.

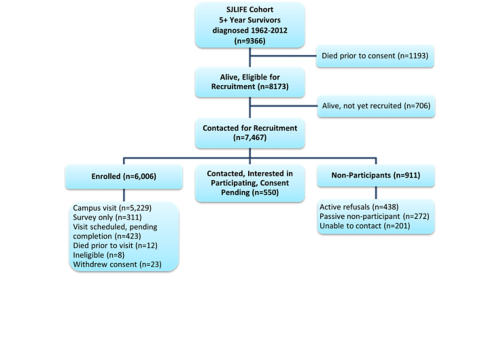
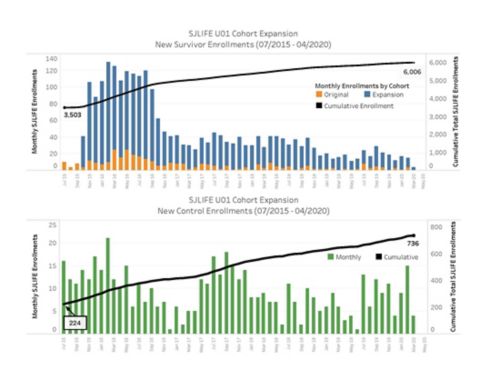
As of April 30, 2020, for survivors where attempts to contact have been initiated, 80.4% (6006/7467) have been successfully enrolled and 87.8% have enrolled or have confirmed their interest in participating. Of all eligible survivors who are alive, 73.5% (6006/8173) have thus far been enrolled and 80.2% have enrolled or confirmed their interest in participating.

Survivor participants who have completed their baseline clinical assessment are invited to return for subsequent systematic evaluations at a minimum of every 5 years. As of April 30, 2020: 53% (2776/5229) of survivors who had completed a baseline clinical assessment have returned for one or more subsequent follow-up assessments.
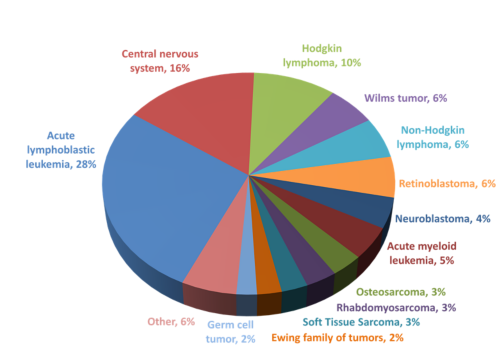
SJLIFE includes all pediatric hematological and solid malignancies.

